


2018年4月17日,清华大学生命学院王一国实验室与代谢组学平台刘晓蕙、许丽娜合作在《Cell Discovery》在线发表题为《一种基于稳定同位素的高胰岛素-葡萄糖钳夹技术新方法》(Evaluation of insulin sensitivity by hyperinsulinemic-euglycemic clamps using stable isotope-labeled glucose)的研究论文,开发了一种基于稳定同位素的高胰岛素-葡萄糖钳夹技术新方法,可用来评价小鼠模型胰岛素抗性。
胰岛素抗性是一些常见代谢疾病的一个重要影响因子,而高胰岛素-葡萄糖钳夹技术是用来评估胰岛素的 “金标准”。常规的高胰岛素-葡萄糖钳夹术使用放射性同位素示踪的方法来检测葡萄糖代谢速率。放射性同位素具有灵敏度高的优势,但是对环境和人体伤害很大,同时在动物模型上的应用也需要严格的实验条件。代谢组学平台开发的稳定同位素结合高分辨质谱的新方法可以达到放射性同位素方法同等灵敏度,在简单安全的实验条件下完成小鼠的胰岛素抗性检测。
该方法使用glucose-2H2作为示踪剂,只需用15ul血浆即可完成分析。文章中采用了HFD (High Fat Diet)和RD (Regular Diet)小鼠模型,对该方法的稳定性和准确度进行了评估。
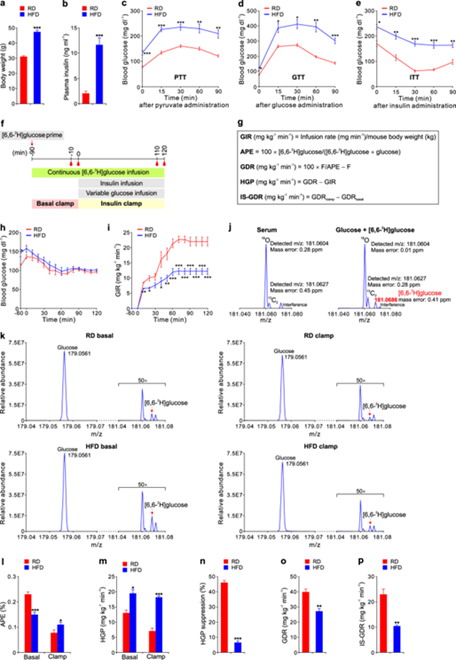
Evaluation of insulin sensitivity by hyperinsulinemic-euglycemic clamps using [6,6-2H]glucose in mice.
a–e Comparison of body weight (a), plasma insulin levels (b), pyruvate tolerance test (PTT, c), glucose tolerance test (GTT, d) and insulin tolerance test (ITT, e) in mice fed with a regular diet (RD) and a high-fat diet (HFD) for 16 weeks. f A time-line of the procedure for performing the insulin clamp. Blood samples were taken at time −10, 0, 110, and 120 min for further analyses. g The equations used to calculate and evaluate insulin sensitivity. f indicates the constant isotope infusion rate. h, i Blood glucose levels (h) and glucose infusion rate (GIR, i) measured during clamp studies. j Representative MS spectra showing the isotopic fine structures of glucose (M+2) in mouse serum and in a standard mixture of glucose (1 mg ml−1) and [6,6-2H]glucose (1 μg ml−1). k Representative MS spectra of monoisotopic peaks and M+2 isotopic fine structures of glucose with infused [6,6-2H]glucose extracted from the serum of mice fed a RD or HFD for 16 weeks. The intensity of the M+2 isotopic envelopes is magnified by 50-fold on each spectrum. All peaks are displayed using relative abundance on the same scale. l, m Atom percent excess (APE, l) and hepatic glucose production (HGP, m) under basal and clamp conditions are shown. n–p HGP suppression (n), glucose disposal rate (GDR, o), and insulin-stimulated GDR (IS-GDR, p) are shown. Data are shown as mean ± s.e.m. *P < 0.05, **P < 0.01, ***P < 0.001, n = 5